The optimisation is finished and the report arrives. There are green screenshots, several charts and a reassuring sentence: “The website is much faster now.” One small but useful detail is missing: knowing what has actually been verified.
A WordPress speed optimisation report should let you review the work without reconstructing it through a long email thread. What changed, what was measured, under which conditions, which functions still work and what remains open? Those answers support an informed acceptance decision.
This guide provides an original handover template, review matrix and arithmetic example using fictional data. They help you request and interpret evidence; they do not describe a completed customer optimisation. To review a delivery, request a WordPress performance results assessment with the scope, URLs and question you need resolved.
The report should answer the approved commission
Before reading the figures, retrieve the accepted proposal. Identify included pages, profiles and functions. A homepage improvement can matter, but it does not independently answer a commission concerning product filters or shipping calculations.
Connect each requirement to evidence. If the scope included an interaction, ask for a record of that interaction. If preserving the design was included, ask for the agreed elements to be reviewed. Verification should follow the specific promise that was approved.
The WordPress optimisation quote guide for 2027 helps establish that relationship before commissioning. This report belongs at the other end: it organises delivered evidence and the decisions that evidence supports.
A copyable template for a reviewable handover
Use one record per intervention and link detailed reports from it. This is an index of decisions, not a place to paste passwords, customer records or complete traces of private sessions.
WordPress optimisation report | reference:
Approved scope and acceptance owner:
Reviewed URL, template, language and action:
Previous release / delivered release / change date:
Applied changes and their dependencies:
Measurement method, tool and conditions:
Original samples and summary method:
Performance result per requirement:
Functional and visual result per journey:
Post-publication check and safe alternative:
Limitations, exceptions and open actions:
Decision, cited evidence, owner and date:
Give files and results references that remain findable later. “Final screenshot” is unhelpful when six versions are attached. A report identifier, timestamp and URL let somebody locate the specific evidence supporting the decision rather than choose whichever attachment looks most convincing.
Where a field has no result, retain “not measured” or “pending” with a reason. Filling it with an assumption makes the next investigation harder. A useful handover separates what is known from the work still needed to establish an answer.
Check comparability before calculating improvement
Review URL, tool, profile, network, session, consent and cache criteria. Identify the deployed release. When a condition changes, the report should explain whether the comparison still answers the same question and which interpretation remains justified.
The reproducible WordPress testing guide covers preparing that experiment. At handover, ask for the protocol actually used and documented differences. You do not need to redefine every tool to establish whether the agreed conditions were followed.
Comparing different states can be useful during diagnosis. The problem is presenting that comparison as the intervention’s before and after without justification. A different device profile or session can change how the figures should be interpreted, even when both captures are authentic.
A delivery review matrix
This matrix is our editorial review tool. Record a result, evidence reference and owner for each row. Possible states are “verified”, “failed”, “incomplete” and “not applicable with reason”; agree their meaning with the team approving the work.
| Reference | Review question | Evidence to locate |
|---|---|---|
| VAL-01 | Was the agreed scope measured? | URLs, actions, profiles and release |
| VAL-02 | Are comparison conditions coherent? | Protocol, samples and differences |
| VAL-03 | Did the relevant indicator improve? | Result per requirement and its limits |
| VAL-04 | Do affected journeys work? | Functional checks and outcomes |
| VAL-05 | Are agreed design and consent behaviours preserved? | Review of included states and elements |
| VAL-06 | Was the published release checked? | Deployment, review and assigned open actions |
Avoid turning the matrix into six green marks without supporting records. If the provider supplies a laboratory screenshot, identify which requirement it supports. One document can support several rows when its actual scope covers those questions, rather than because it contains an attractive overall score.
Acceptance also needs to address failures. A broken commercial function requires an explicit decision and correction or agreed alternative. Averaging the other rows cannot transform that failure into a complete delivery. Keep the exception visible to the person making the decision.
Three examples of a written review decision
These cases are fictional and illustrate how to record a review outcome. They do not represent completed engagements or customer approvals.
- REV-01: a bounded check closes. The report contains comparable samples and evidence for included functions. The owner accepts those identified requirements; later user monitoring remains open with a date and named owner. The decision cites reviewed files and excludes untested scenarios. Everybody can see what was accepted without extending the conclusion to the entire website.
- REV-02: a function fails. A loading metric improves in the example, but the agreed form journey does not complete its operation. Record the failure, evidence and correction owner. Choosing a repair or return to a safe state follows the change procedure. That part of the commission is not complete merely because the metric improved.
- REV-03: evidence cannot be located. The presentation contains figures without findable conditions or samples. Request the documentation needed to assess comparability. The state stays incomplete, identifying a reporting gap without yet concluding that the technical intervention failed or commissioning another optimisation blindly.
Each case leaves a written next action and owner. That record reduces circular discussions: the provider knows what to supply, and the approver knows what must be reviewed before changing the status. It also gives a second reviewer the reason behind the decision.
Original exercise: correct arithmetic, unsupported conclusion
These data are fictional. On 25 October 2026, we ran a local calculation with two invented five-value timing series. We deliberately assigned different profile labels to examine what their summaries support. They are not website measurements or results from a customer engagement.
Series A, mobile profile:   3200, 2800, 3000, 3100, 2900 ms
Series B, desktop profile:  2600, 2400, 2500, 2700, 2300 ms
Calculated medians:        3000 ms and 2500 ms
Arithmetic difference:     500 ms lower; 16.67%
Matching profiles:         no
The medians and arithmetic difference are correct for those series. They do not demonstrate a performance improvement caused by optimisation: the comparison profile changed. The review decision would be to request comparable evidence before accepting that claim.
This separates two report checks: summary accuracy and comparison validity. A spreadsheet can resolve the first without resolving the second. None of these figures is a real outcome you should require from your project or use as an industry benchmark.
An observed case that is not a before-and-after result either
The guide to passing PageSpeed reports and slow journeys documents laboratory profiles of this website: desktop 99 and emulated mobile 79. No optimisation occurred between them, and no real-user field data was available.
If those captures arrived in a report without context, they could easily be mistaken for progress. The review question is what changed between them. The report link, profile and date let somebody establish that they represent different conditions rather than a repair.
Keeping that context is part of accepting a delivery. A figure can be authentic while being used to support a conclusion it does not establish. Ask for each result to be connected to its test and the requirement it is intended to close.
A visual summary should lead to the underlying detail
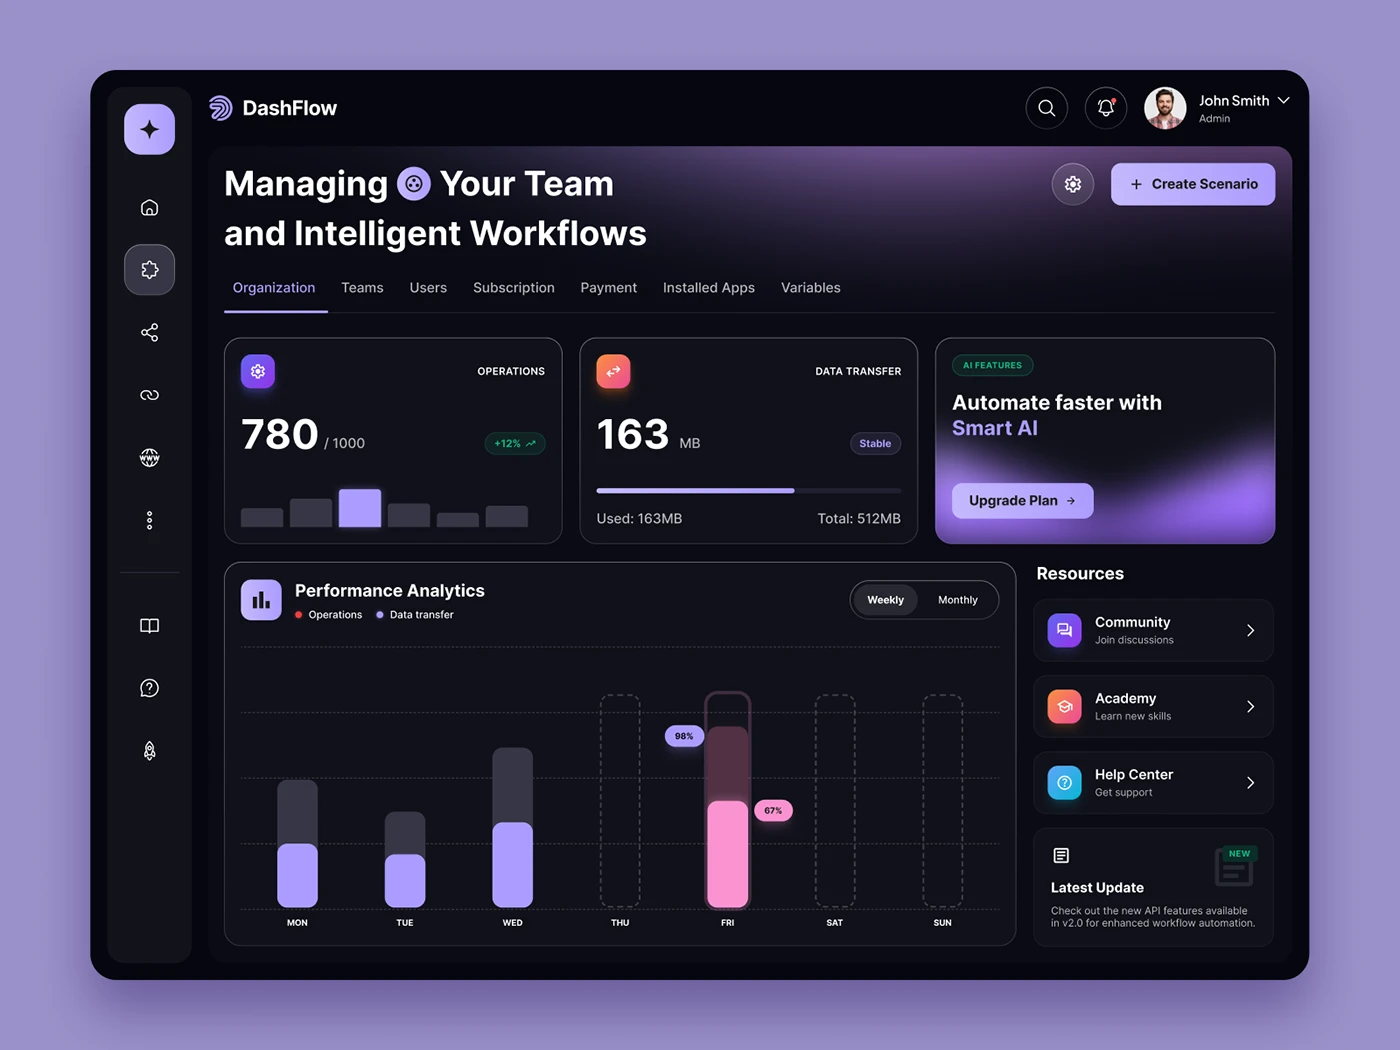
The reference supports thinking about report hierarchy: overview, comparison and findable detail. Its indicators belong to the project shown. In your handover, each summary card needs to identify its metric and point to evidence that allows review.
Separate loading, interaction and functional results
An initial-load measurement does not automatically establish the responsiveness of filters, menus or forms. Organise the report around the moment observed. That makes it possible to see whether the commissioned problem received a specific check.
The web.dev measurement guide distinguishes laboratory and field evidence. Identify each result’s source and preserve its scope in the handover. Historical user data and a controlled test should not be treated as the same sample.
Also establish that the journey ends correctly. A form can respond quickly without completing the expected operation. The report needs the agreed functional outcome alongside observed timing when that timing belongs to the objective. A quick error response is still an error response.
Design and consent belong in the review too
Identify what was supposed to be preserved: imagery, typography, navigation, motion or banner states, as applicable. Ask for relevant views and approved changes to be reviewed. Do not assume that a removed asset or interaction was unnecessary to the business.
If work changes lazy loading or scripts, record the consent states checked and the functions observed in those states. A test before making a cookie choice does not automatically establish behaviour after a different choice.
Where a check could not be performed, leave it incomplete with its dependency. That information allows the remaining review to be scheduled without presenting an unvisited scenario as verified. It also gives the next reviewer a useful place to start.
What should be recorded when publishing?
The report should identify the production release, date and applied changes. Preserve differences from the trial environment and the checks performed after deployment. Approving a test copy is different from observing the published release in its actual configuration.
Add configuration and dependencies another professional will need to maintain, using protected references. Record licences, relevant rules and owners. Secret values belong in their management system rather than a commercial PDF circulated across the project team.
If performance drops after a later update, the guide to comparing WordPress after changes helps investigate from a known release. A useful handover leaves that reference available instead of requiring everybody to reconstruct the previous state.
Record the decision and remaining work
Write which scope is accepted, with which evidence and on which date. Partial acceptance should name the open rows and their effect on delivery. Every action needs an owner, next check and closure criterion so the handover does not quietly become an abandoned backlog.
Separate observed defects, newly requested functions and data follow-up that requires time. They are different discussions. The report should support those decisions without overwriting the original outcome or attributing every subsequent change to the intervention.
If the engagement includes observing user data after launch, retain that commitment with its method and review period. A laboratory check can close while that follow-up stays open, provided the document explains the distinction and names who will complete the later review.
A real before-and-after on this website: font delivery
On 25 October 2026 we changed how our own website delivers Sora. Previously, the Spanish homepage requested a Google Fonts stylesheet followed by the font file. It now uses the same original files from the WebSpeed Optimize domain, with font declarations included in the HTML. We retained the typeface, weights, character subsets and the Sora authors’ SIL Open Font License.
The intervention removed an external stylesheet dependency; it involved neither a redesign nor a content change. Theme files kept their fingerprints, and the nine checked pages and posts retained their data during the intervention. We also compared main text and heading family, weight, size and geometry across all twelve loads: they matched.
The comparison protocol
We measured six loads before and six after of the same public Spanish homepage, using Chromium 152.0.7977.82. Each visit launched a fresh browser with a 1280 × 900 CSS-pixel viewport, scale 1 and es-ES locale. Browser caching was disabled. Network emulation used 150 ms latency, 200,000 bytes per second download and 93,750 upload, with a four-times CPU slowdown.
No interaction or cookie choice occurred during sampling: every visit began in a fresh anonymous context. We recorded the LCP candidate, FCP and layout shifts through an initial window of approximately eight seconds. This is emulated desktop measurement, rather than a physical-phone test or real-user data. It does not guarantee cold DNS, operating-system or CDN caches.
| Metric | Before | After |
|---|---|---|
| Loads | 6 | 6 |
| LCP candidate, median | 2396 ms | 2316 ms |
| LCP candidate, minimum–maximum | 2300–2512 ms | 2224–2608 ms |
| Window CLS, median | 0.0264 | 0.0264 |
| Observed font requests per visit | 2 external: CSS and WOFF2 | 1 local: WOFF2 |
The conclusion needs more than a green number
The median LCP candidate fell by 80 ms, but the ranges overlap. The slowest subsequent load was also slower than every earlier load. We kept that result rather than sending it out for coffee while preparing the table. The two series ran sequentially, so network and server variation remain possible influences.
The delivery change itself is verified: all six earlier visits showed two external font requests; all six later visits showed one local font-file request. The browser continued rendering Sora and the heading kept its dimensions. We retained local delivery for the reduced dependencies and absence of an observed design regression, without turning an 80 ms difference in this sample into a universal promise.
Download all twelve measurements, the CSV and response context. The package includes every attempt in the series, conditions and dates. The web.dev font guide also recommends checking delivery rather than assuming that self-hosting will always be faster.
This case establishes neither field INP, a Lighthouse score, increased sales nor more Google clicks. When reviewing a delivery, request the same set: an identifiable change, comparable conditions, the complete series, design checks and a conclusion proportionate to the measurements. The report should help you accept the work and decide what deserves investigating next.
What to send for a second review
Share the approved scope, URLs and available reports, identifying the claim you cannot verify. A description and public references are enough to begin defining the review. Private files can be requested through an agreed channel when they are needed.
The useful question is specific: which requirement lacks evidence, and what would resolve it? That supports agreeing a report review, additional tests or corrective work as appropriate before making another production intervention.